
If you want to understand why visitors leave your site without converting, two tools come up constantly: Hotjar and Microsoft Clarity. Hotjar is polished and popular, but its free plan limits you to 35 sessions per day. Microsoft Clarity, by contrast, is completely free — no session caps, no usage limits, no credit card required — and it’s surprisingly powerful for what you pay.
This guide walks you through setting up Microsoft Clarity from scratch, from creating your account to reading your first heatmaps. It takes about ten minutes.
What Is Microsoft Clarity?
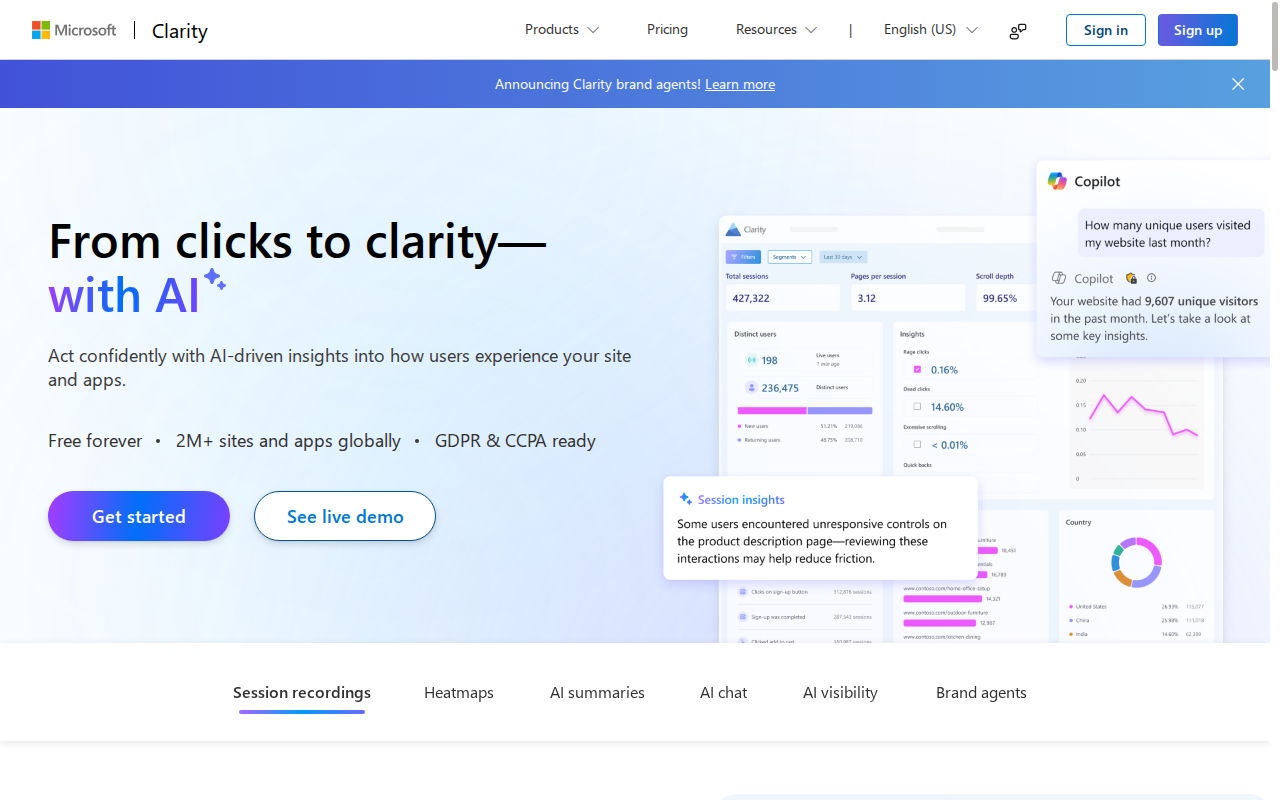
Microsoft Clarity is a free behavioural analytics tool that records how real visitors interact with your website. It captures:
- Heatmaps — click, scroll, and move maps that show where users tap, how far they scroll, and where their cursor moves
- Session recordings — video-style playbacks of individual user sessions, showing exactly where people hesitate, click, or abandon
- Automated insights — Clarity automatically flags rage clicks (repeated frustrated clicks in the same spot), dead clicks (clicks on non-interactive elements), and excessive scrolling patterns
- Copilot AI summaries — AI-generated explanations of what the data means in plain English
Clarity works on any website — WordPress, Shopify, Wix, Webflow, custom-built sites, it doesn’t matter. You install a JavaScript snippet and you’re done. There are no data caps, and your data is never sold for advertising.
One important note: Clarity does not replace Google Analytics. GA4 tells you what is happening (traffic, conversions, bounce rates). Clarity tells you why — the behavioural context behind those numbers. The two tools are complementary, and Clarity actually integrates directly with GA4 so you can connect session recordings to specific GA4 segments.
Step 1 — Create Your Microsoft Clarity Account
Go to clarity.microsoft.com and click Get started for free. You’ll sign in with a Microsoft account (Outlook, Hotmail, or a work Microsoft 365 account). If you don’t have one, you can create one for free in under two minutes.
Once you’re in, Clarity will ask you to create your first project.
Step 2 — Set Up Your First Project
A project in Clarity corresponds to one website. On the project creation screen, enter:
- Project name — something descriptive, like the site name
- Website URL — the full domain, including https://
- Industry — used for Clarity to provide relevant benchmarks and suggestions (optional but worth filling in)
After saving, Clarity generates your tracking code. This is a small JavaScript snippet, unique to your project.
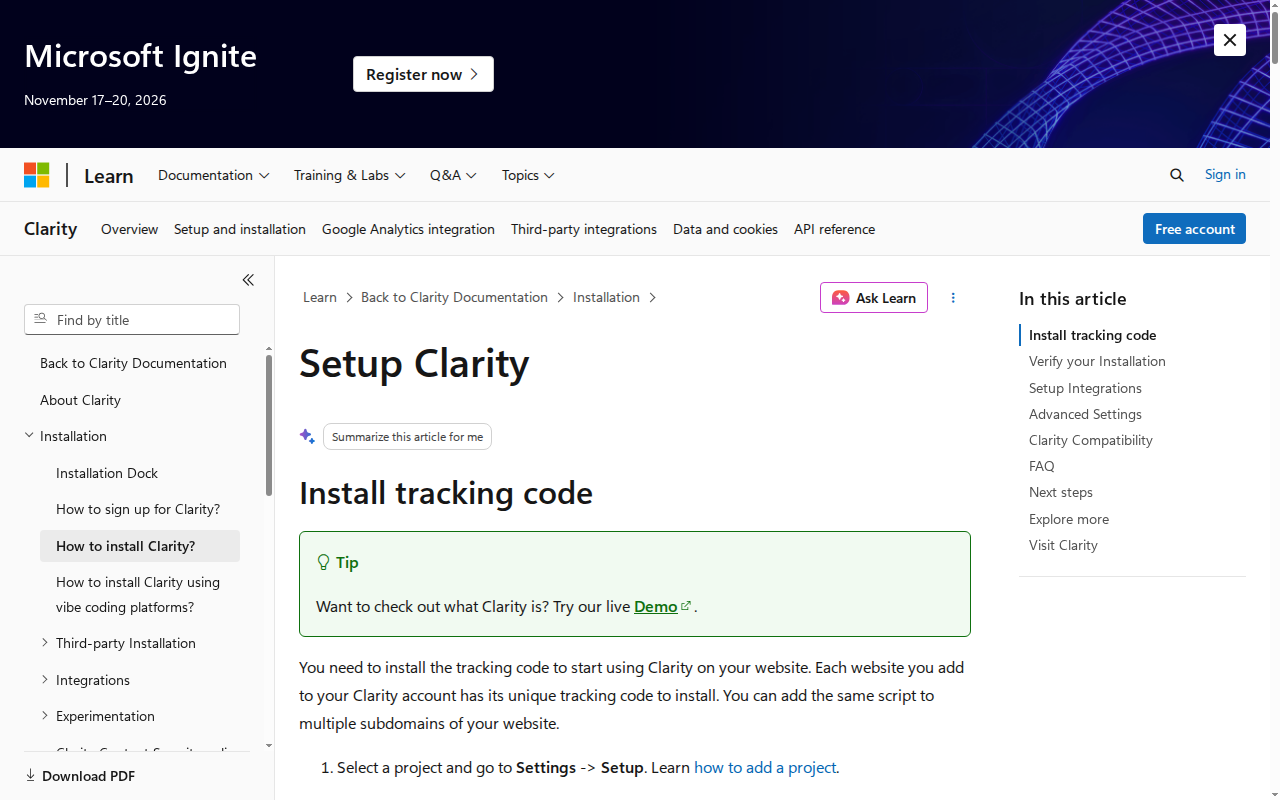
Step 3 — Install the Tracking Code
How you install the tracking snippet depends on your platform.
WordPress
The easiest method on WordPress is to install the Microsoft Clarity plugin from the WordPress plugin directory. Search for “Microsoft Clarity” in Plugins → Add New, install and activate it, then paste your Project ID (not the full script — just the ID) into the plugin settings. Clarity handles the rest.
If you prefer to add it manually, paste the snippet directly into your theme’s <head> section. A child theme or a plugin like WPCode is safer than editing header.php directly, since theme updates will overwrite direct edits.
Shopify
In Shopify, go to Online Store → Themes → Edit Code. Open theme.liquid and paste the Clarity snippet just before the closing </head> tag. Save and you’re done.
Any Other Platform
Paste the snippet into the <head> section of your site’s base HTML template, or add it as a custom HTML tag through Google Tag Manager (GTM) if you’re already using it. The GTM route is particularly clean because it keeps all your tracking scripts in one place and lets you manage them without touching code.
Step 4 — Verify the Installation
Once the snippet is installed, Clarity shows a verification step in the dashboard. Visit your website in a browser and wait about 30 seconds. Clarity will detect the incoming data and confirm the installation is working.
You can also check manually using browser dev tools: open the Network tab, filter by “clarity”, and refresh your page. If the Clarity script fires, you’ll see a network request to clarity.ms.
Step 5 — Read Your First Heatmaps
After 24–48 hours, Clarity begins generating heatmaps. Navigate to the Heatmaps section of your dashboard to see them.
There are three heatmap types, and each reveals something different:
- Click heatmaps show where users click most frequently. A high click concentration on a non-clickable element is a UX problem worth fixing. Low clicks on your primary CTA button may indicate a placement or contrast issue.
- Scroll maps show how far users scroll down a page. If the drop-off is sharp at a certain point, your content or page structure may be losing people before they reach your key message or CTA.
- Move maps show where cursors hover, which roughly approximates where users are reading or pausing. On desktop, this is useful for identifying where user attention concentrates.
Heatmaps can be filtered by device type (desktop, tablet, mobile), date range, traffic source, and custom segments. If your mobile traffic behaves very differently from desktop — which it almost always does — filter by device to get an accurate picture of each experience.
Step 6 — Watch Session Recordings
Session recordings are often where the most useful insights come from. Navigate to Recordings and you’ll see a list of individual user sessions, each tagged with duration, page count, rage clicks, dead clicks, and any quick insights Clarity has automatically flagged.
Start with sessions that Clarity has already flagged as containing rage clicks or dead clicks. These are almost always pointing to a real UX issue — a broken link, a confusing interactive element, or a CTA that doesn’t look clickable.
The recordings respect privacy by default: text input fields are automatically masked so you won’t see passwords or personal data. You can configure additional masking rules if needed.
Connecting Clarity to Google Analytics 4
One of Clarity’s most useful features is its native GA4 integration. Once connected, Clarity embeds a link to relevant session recordings directly inside your GA4 reports, so when you see a drop-off in a GA4 funnel, you can immediately watch the sessions that contributed to it.
To set this up, go to Settings → Google Analytics in Clarity and follow the connection prompts. You’ll need view access to the relevant GA4 property. The setup takes about two minutes.
Practical Use Cases
Here are three common situations where Clarity pays off quickly:
Low conversion rate on a landing page: Install Clarity, let it collect a few hundred sessions, then watch five or ten session recordings. You’ll almost always find a specific friction point — a form field that confuses people, a CTA below the fold that most users never see, or a mobile layout that breaks the intended flow.
High bounce rate on a specific page: Use scroll maps to check how far users are getting before leaving. If most of them leave before reaching what you consider the main value of the page, you need to restructure the content to deliver that value higher up.
Understanding returning vs. new visitor behaviour: Filter heatmaps and recordings by new vs. returning visitors. Returning visitors who still seem confused are often a sign that your product isn’t delivering on its promise — a customer satisfaction issue, not just a UX one.
Clarity vs. Hotjar: When Does Free Win?
Hotjar’s paid plans start at $39 per month and offer features like user surveys, form analytics, and more sophisticated filtering. If you need those features, Hotjar is worth the investment.
But for most websites — especially those just getting started with behavioural analytics — Clarity’s free offering is genuinely sufficient. The session recording quality is comparable, the heatmaps are clear and useful, and the Copilot AI summaries help non-analysts interpret what they’re seeing without needing a data team.
The only meaningful limitation of Clarity for larger sites is the absence of funnel analysis and user survey tools. These are valid reasons to pay for Hotjar if your site has the traffic and conversion volume to make that analysis worthwhile.
For anyone not yet tracking user behaviour on their site, Clarity is an obvious first step: zero cost, ten-minute setup, and real insight from day two. There’s no reason not to run it.. The official Microsoft Learn documentation covers all platform integrations in detail
If you’re building out a broader analytics stack, the best website monitoring tools guide covers complementary tools that track uptime, performance, and error rates alongside user behaviour. You might also find the Perplexity AI for business research guide useful if you’re using AI tools to supplement your analytics workflow.